Building
Lacquer.
Give Lacquer a finished stereo mix and it rebuilds clipped peaks, removes echo and excess reverb, checks the instrument balance, evens out level problems, and masters the result against the measured norms of released music or a reference track. It reports every decision with the reading behind it, and leaves alone whatever is already fine.

Each problem goes to the tool that suits it
Problems with an exact answer use DSP. Hard clipping leaves the samples under the ceiling intact, so the peaks are rebuilt as the sparsest spectrum consistent with them. A discrete echo is one spike in the cepstrum, read off and inverted with an exact filter. Problems that need a prior about what music sounds like use a network: a 51 M parameter band-split transformer predicts a complex mask on the stereo spectrogram and removes room reverb. Aesthetic choices such as tone, stereo image and dynamics are measured against the range of released music and left alone inside it.
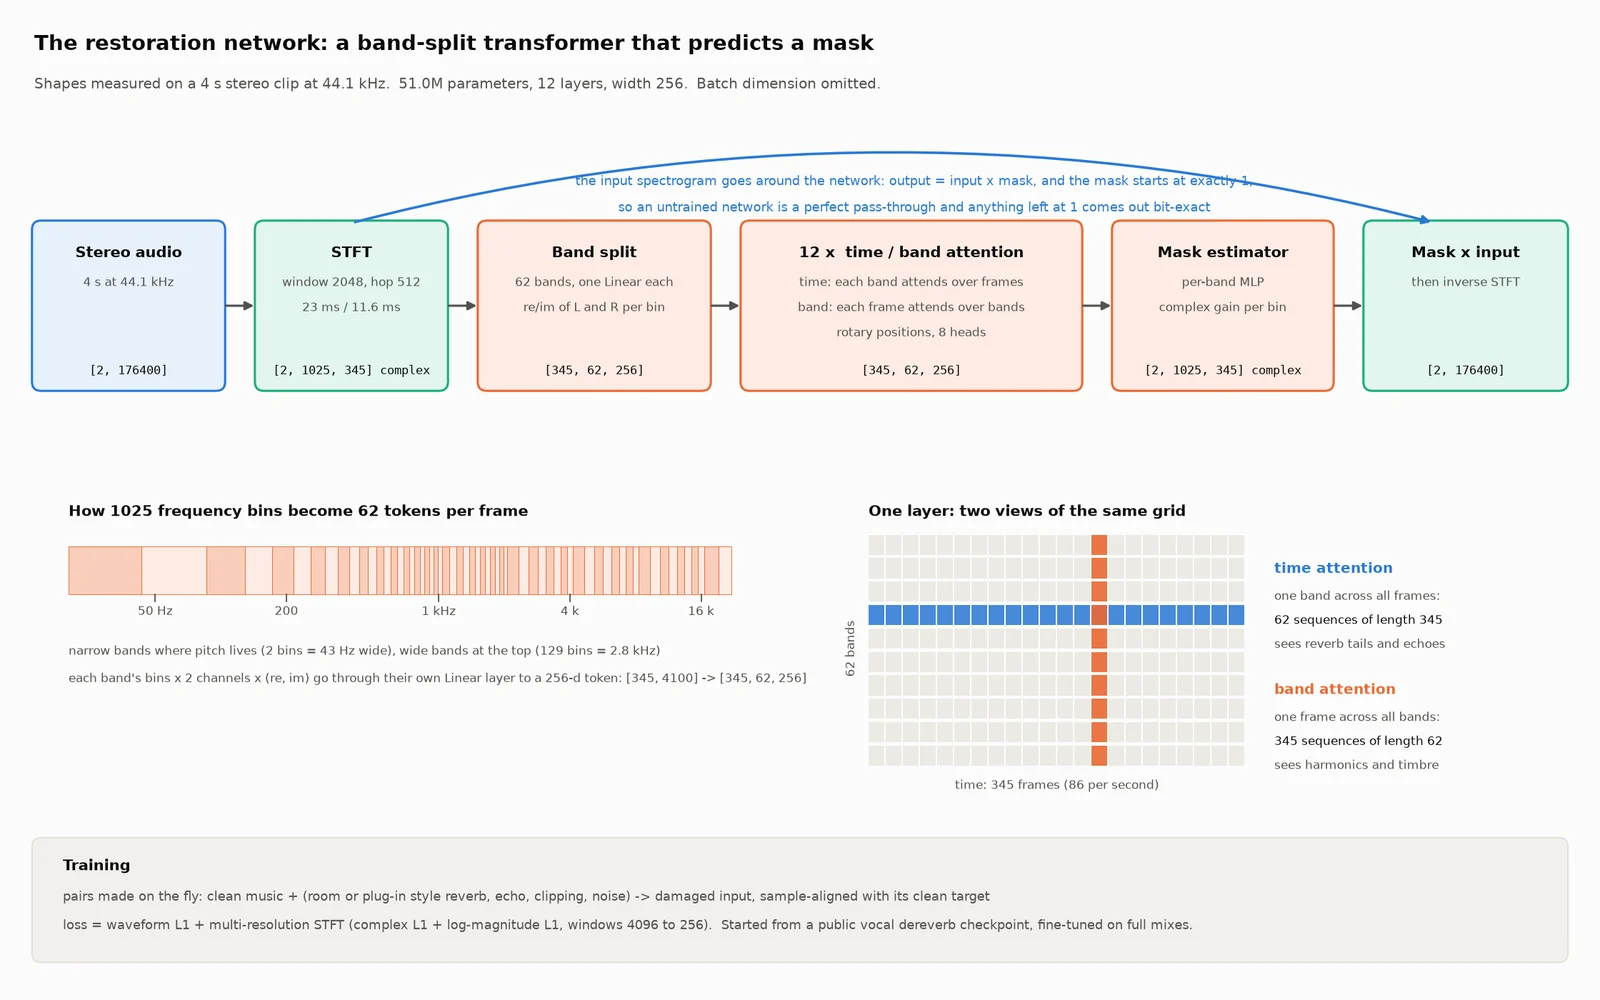
The network never generates audio. It multiplies the input spectrogram by a mask that starts as all ones, so anything it does not touch passes through unchanged. There is no codec or vocoder in the path.
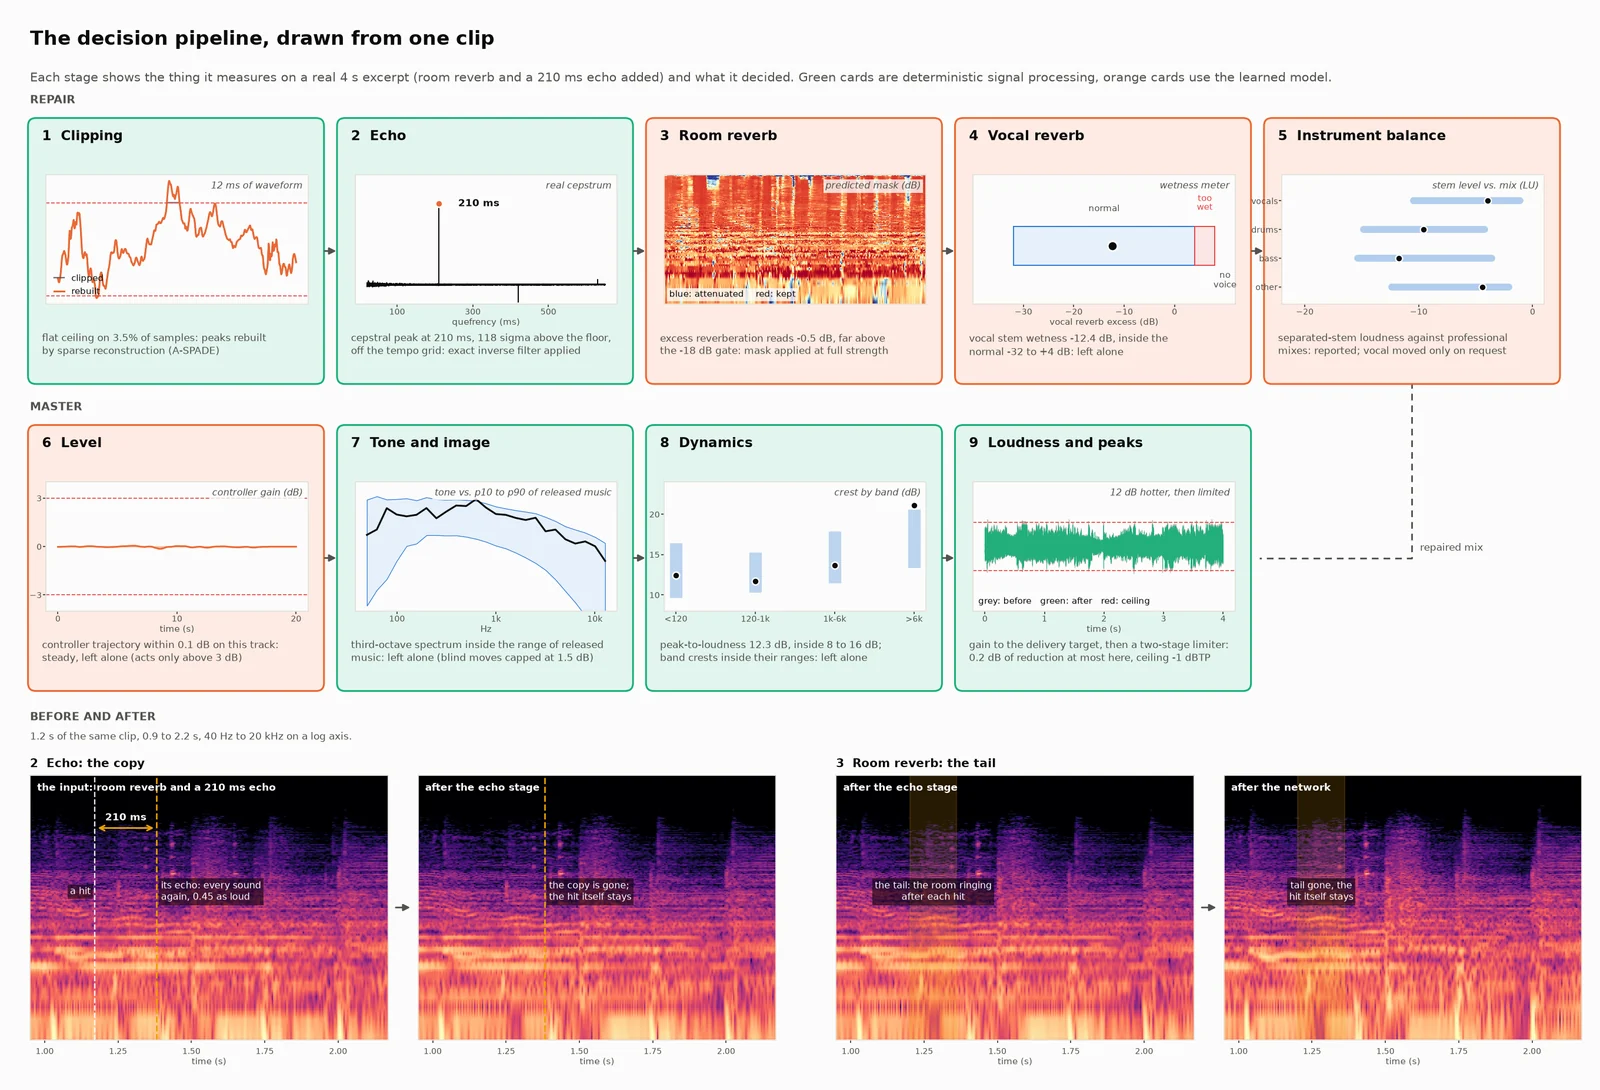
Nine decisions, each with a reading
The pipeline runs the stages in order and returns a report. A stage that finds nothing outside its range does nothing, so a track that is already fine comes out unchanged apart from the loudness target.
- Clipping. A channel whose samples pile up at a flat ceiling on both polarities was hard-clipped. The peaks are rebuilt by consistent sparse reconstruction. No ceiling, no action.
- Echo. A delayed copy is a sharp peak in the cepstrum. The delay and echo path are read off and inverted. A delay on the tempo grid is a delay effect or a loop, so it is reported and left alone.
- Room reverb. The network’s proposed change is measured first. Clean productions read about −42 dB and 95% of released tracks are under −20 dB. Above the −18 dB gate the reverb is removed, scaled by how far above; below it the network is bypassed.
- Vocal reverb. The separated vocal gets an absolute wetness reading. Produced vocals span a wide range, so the vocal is reduced to the edge of that range only when it is clearly past it. Stems are remixed only when the vocal changed.
- Instrument balance. Each stem’s loudness relative to the mix is compared with its range in professional mixes. Readings outside it are reported. On request a vocal is moved to the edge, applied as a stem difference so untouched stems contribute nothing.
- Level. A small controller network predicts a gain trajectory for the whole track, applied as a fader move when it exceeds 3 dB. A steady track is left alone.
- Tone and stereo image. Third-octave bands and band-wise side level outside the genre’s range are moved to its edge, by at most 1.5 dB unless a reference track is given.
- Dynamics. Band crest factors and the peak-to-loudness ratio are compared with the genre’s range. Peaky mixes get 2:1 compression on the excess; mixes that are already dense are flagged and protected.
- Loudness and peaks. Gain to the delivery target, then a two-stage true-peak limiter inside a 3 dB budget. A target that needs more is not reached, and the report says by how much.
3. Room reverb
Network as a meterThe restoration network's proposed change, measured on a few windows before anything is applied.
Normal range. Clean productions read about −42 dB; 95% of released tracks are under −20 dB. The gate is −18 dB.
Bypass the network.
−30.0 dB is below the −18 dB gate. The proposed change is discarded and the mix passes through untouched, which is what keeps finished productions safe.
Room reverb on 24 MUSDB18-HQ test songs: 4.7 to 9.7 dB SI-SDR. 3 of 98 clean released tracks trip this gate.
What the numbers say
Held-out music with synthetic damage. SI-SDR is closeness to the clean track in dB; higher is better. The last two rows are error measures, where lower is better.
| TEST | DAMAGED | AFTER LACQUER |
|---|---|---|
| Echo, 79 clips (DSP stage alone, no training) | 8.8 dB | 25.2 dB |
| Hard clipping, 29 clips (DSP stage alone, no training) | 20.1 dB | 26.7 dB |
| Room reverb on the whole mix, 24 MUSDB18-HQ test songs | 4.7 dB | 9.7 dB |
| Reverb on the vocal only, same songs | 6.7 dB | 7.8 dB |
| Reverb from a plug-in style the model never trained on, 40 clips | 3.6 dB | 8.7 dB |
| Reverb from six real rooms the model never trained on, 40 clips | 3.1 dB | 5.7 dB |
| Level problems inside a track, 20 clips (envelope error) | 4.5 dB | 2.4 dB |
| Tonal fault with a reference track, 200 tracks (tone error) | 3.1 dB | 0.19 dB |
| A separate judge that never sees the clean reference (Audiobox Aesthetics, production quality on a 1 to 10 scale) rates reverberant clips 6.37, the restored versions 6.63, and the clean originals 6.66. | ||
Against other tools on the same reverberant clips, classical WPE and four released community dereverb models land between −0.5 and 3.9 dB where Lacquer reaches 9.1 dB from an input of 3.2 dB. On real rooms none of them trained on, none of them improves the average; Lacquer gained 1.7 dB there, and 2.6 dB after 6,500 further training steps with simulated rooms added.
With one stage removed at a time, each carries its own fault, and on clean clips 26 of 30 pass through bit-identical. Restored clips keep their notes and get their rhythm back: onset-envelope correlation with the clean track goes from 0.85 to 0.96 under reverb plus echo. Every number has its experiment, data and caveats in the experiment log.
Inside the model
Sound becomes a spectrogram: a 46 ms window slid forward every 11.6 ms, both channels, magnitude and phase kept. Frequency is cut into 62 bands, two bins wide at the bottom and up to 129 bins wide at the top, and each band becomes a 256-number token per frame. Twelve layers alternate attention along time and attention across bands. A small network per band then turns each token into a complex gain for every bin it covers, and an inverse STFT returns audio.
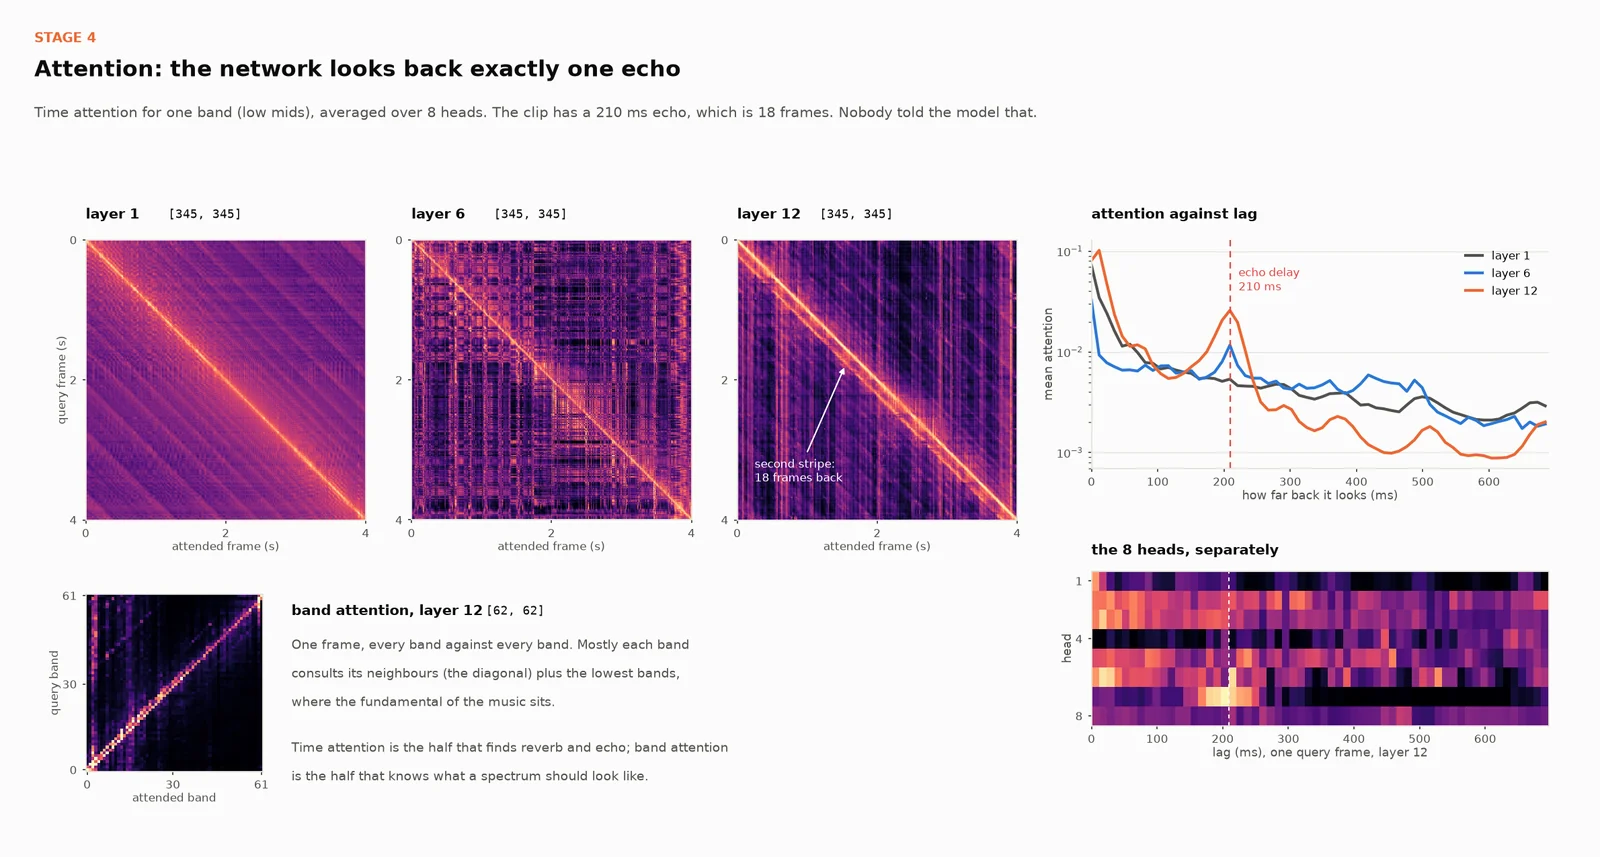
The most direct evidence of what the network learned is in its attention. The traced clip carries an echo 210 ms late, which is 18 frames. In layer 12 the time attention has a second stripe 18 frames below the diagonal, and its average weight against lag peaks at exactly 210 ms. Over 30 held-out clips with random delays from 90 to 500 ms, layer 6 puts its largest relative increase in attention within one frame of the true delay in 30 of 30 clips. The delay was never an input; the network finds the earlier copy of each sound and uses it.
The warm start mattered more than architecture or size. With the architecture and parameter count held fixed, starting from a public vocal dereverb checkpoint was worth 2.9 dB on reverb after 1,000 steps and 3.6 dB after 8,000, against the same 51 M network from random weights. From scratch, the large model did no better than a 7.7 M one or a spectrogram U-Net. The released vocal checkpoint on its own wrecks full mixes, which is why the fine-tune exists.
Mastering as measurement
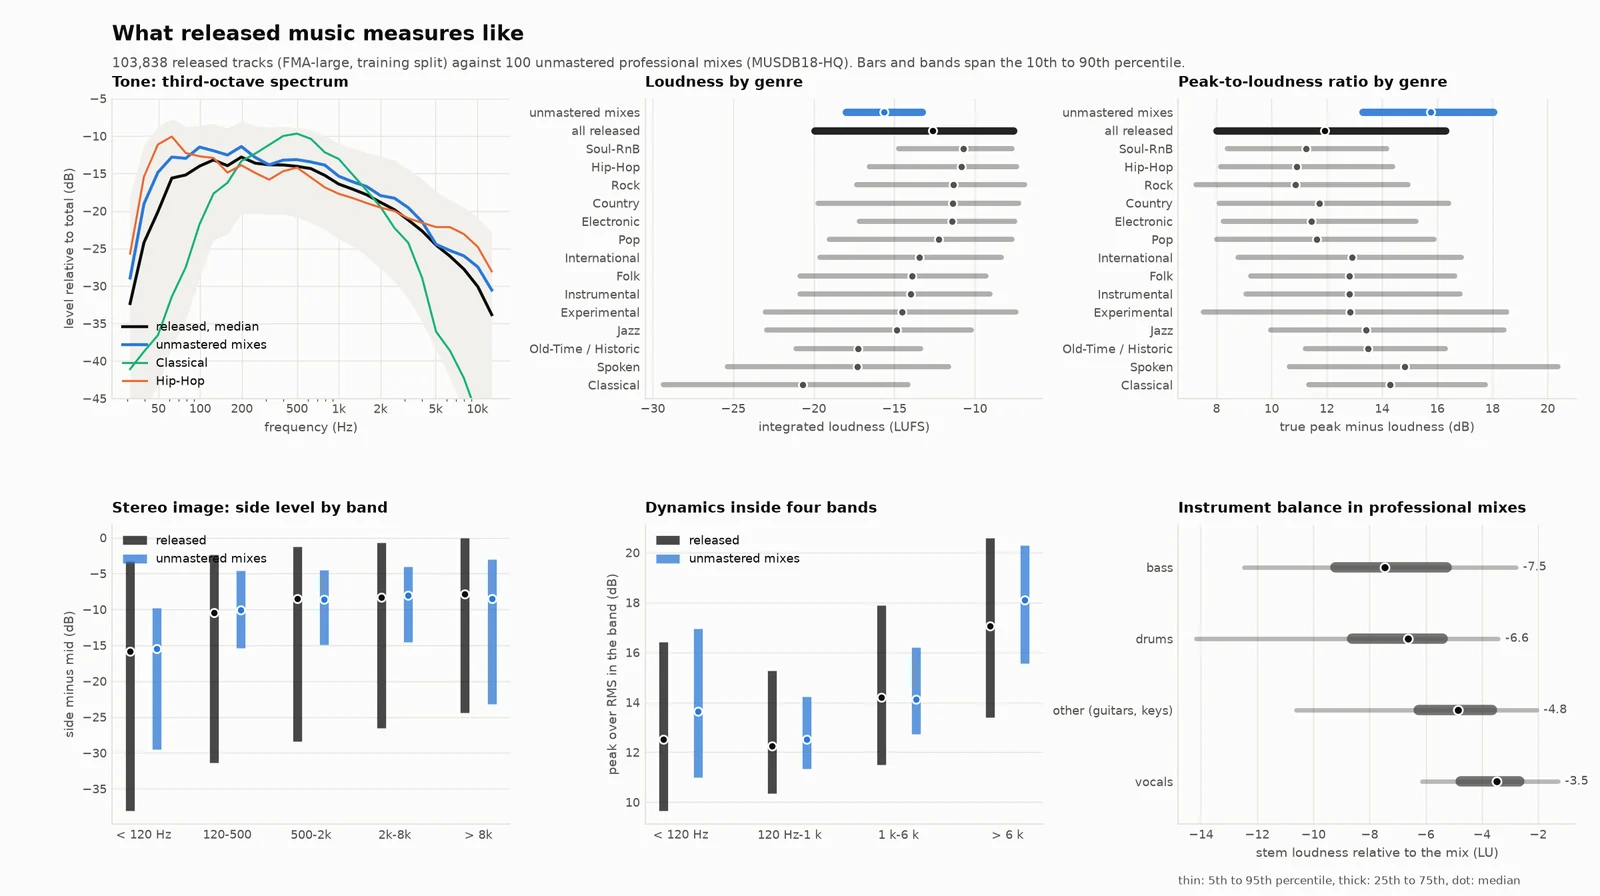
Mastering here means what a mastering engineer does to a mix that is already good: measure it, compare it with released music of its kind, and change as little as the readings call for. The norms come from 103,838 released tracks across 14 genres and 150 unmastered professional mixes, 60 features each.
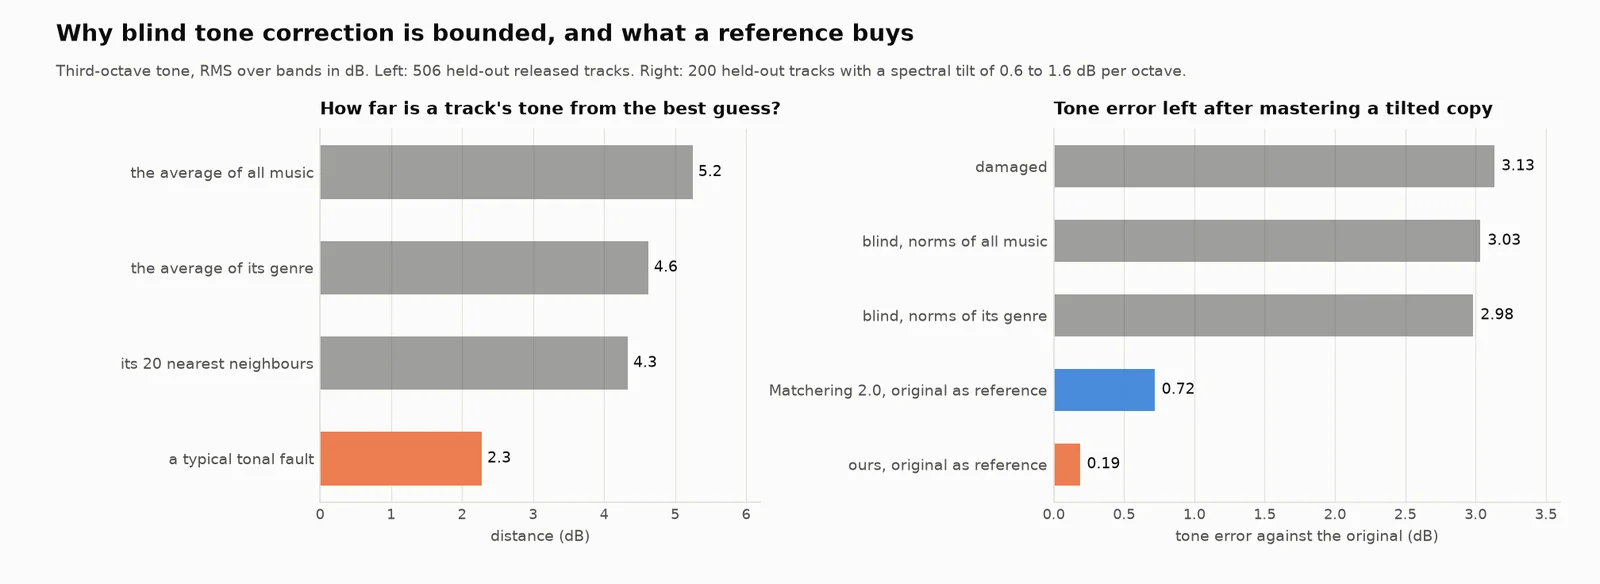
Tone cannot be corrected blind, and the bound is measurable. A track’s own tone is 5.2 dB away from the average of all music, 4.6 dB from its genre and 4.3 dB from its nearest neighbours, while a typical tonal mistake is 2.3 dB. Population norms therefore take back only a few percent of a tonal fault, and no estimator tried does better. So blind tone moves are capped at 1.5 dB and anything larger is reported as a mix problem. A reference track lifts the cap: on 200 held-out tracks with a deliberate tilt and the original as reference, 0.19 dB of tone error remains, where Matchering 2.0 leaves 0.72 dB.
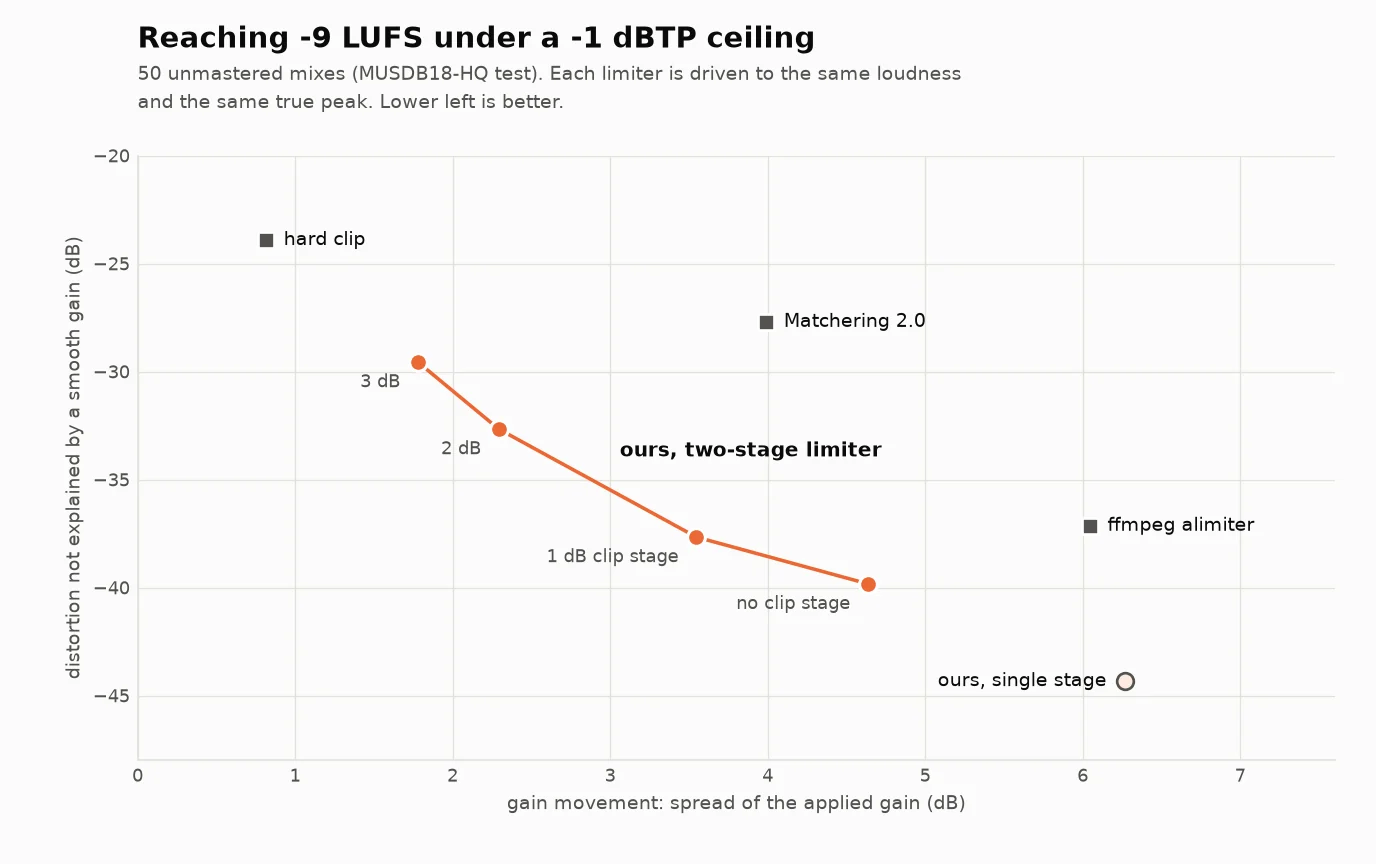
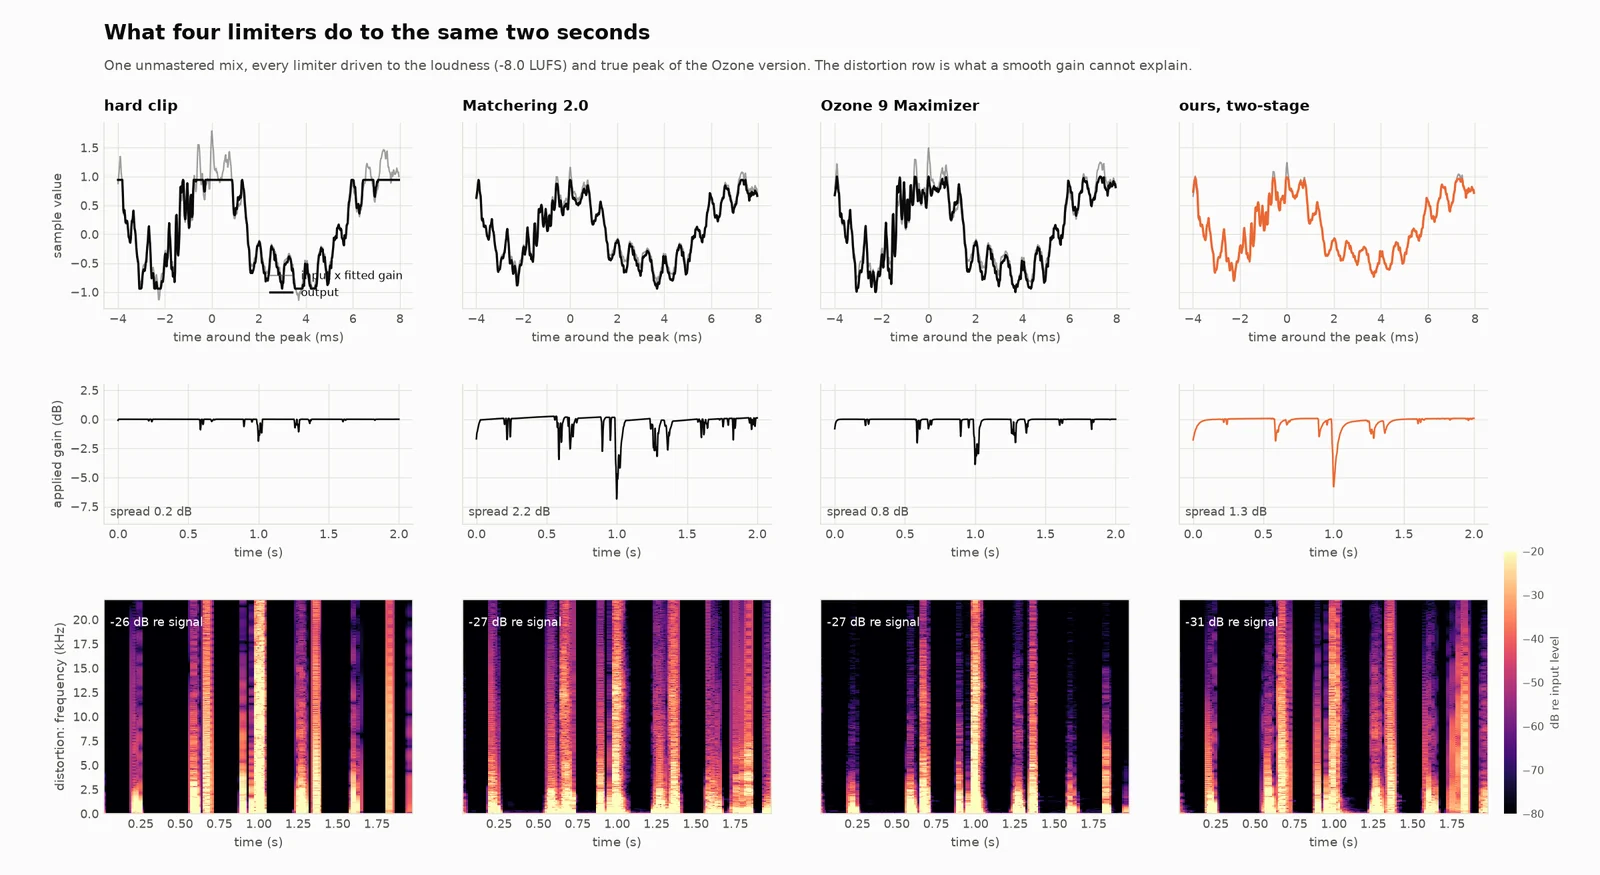
The limiter is where an open tool can beat the baselines. At equal loudness and equal true peak the two-stage limiter leaves 5 to 10 dB less distortion than Matchering’s with less gain movement, and matches ffmpeg’s limiter on distortion with 2.5 dB less gain movement. Against iZotope Ozone 9 on the same songs it leaves 5 to 8 dB less distortion at equal or lower gain movement, while Ozone changes the long-term spectrum least. These are signal measures. Which limiter sounds better is a listening-test question.
What does not work yet
- Unseen real rooms. On six rooms outside the training set the gain drops from 5.9 dB to 1.7 dB. The network learned its 270 training rooms much better than room reverb in general. Adding 4,000 simulated rooms to training raised it to 2.6 dB within 6,500 steps, and that run continues.
- Blind tone correction has an information bound. Track-to-track variation (5.2 dB) is twice a typical fault (2.3 dB). Without a reference, the system moves at most 1.5 dB and reports the rest.
- Clean music is the hardest test. Run on 98 untouched released tracks, the first version of the repair half changed every one of them: tempo-synced delays were removed as echoes, quiet vocal samples were boosted, and the level controller nudged everything. After recalibrating on that audit, 80 of 98 come out bit-identical and the rest are listed proposals, each with its reading and each switchable.
- Noise and soft saturation are not improved. Undoing compression or limiting did not train, and a published de-limiter only partly transfers to a different limiter.
- The careful thresholds have a cost. Light reverb, tempo-synced echoes and moderately wet vocals are left alone on purpose.
- Everything above is synthetic damage on real music. No recordings damaged in the field have been evaluated yet.
Where this came from, and where it goes
My engineering honors thesis took the obvious route first: encode the track with a neural codec, predict clean tokens with a large network (a 1.08 B parameter U-Net over EnCodec tokens) and decode. Measured properly, it could not beat its own input, for three reasons that belong to the route and to no particular network: level is invisible in the tokens, the audio losses sit behind an argmax, and the decoder caps quality at the codec’s own reconstruction. Lacquer keeps the question and changes the method: a mask on the spectrogram, DSP wherever the answer is exact, and a measurement before every action.
A paper is in preparation for DAFx27, the 30th International Conference on Digital Audio Effects in Cremona, August 2027. The call is not published yet. The current draft is here as a PDF, eight pages in the DAFx format, dated October 2026 and not yet peer reviewed. Before submission the work needs a blind listening test (the MUSHRA-style tooling is built and needs 15 or more listeners), a comparison against SonicMaster, the closest published system, and recordings damaged in the field.